What does the Dashboards module do?
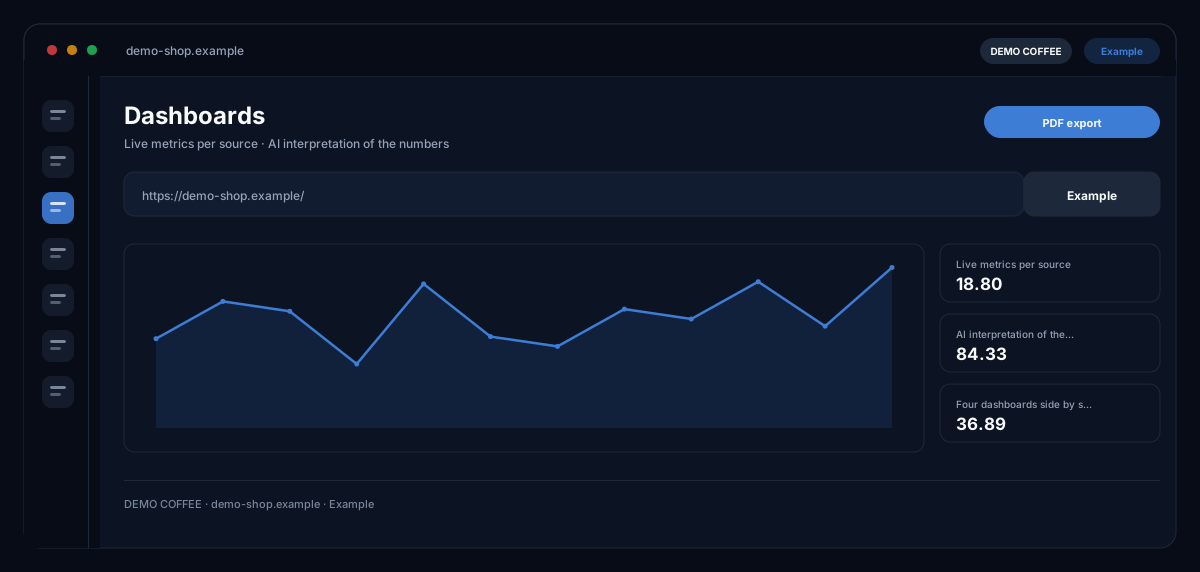
The Dashboards by ecomDNAI show live metrics from Meta Ads, Google Ads, Google Analytics 4, Shopify and Matomo in one place — with previous period and anomalies — and the AI writes up what stands out, instead of just showing charts.
Five data sources in one place: Meta Ads, Google Ads, Google Analytics 4, Shopify and Matomo. The numbers come live from the connected accounts, and the AI writes up what stands out — instead of just showing charts.
How it works
- Connect the account (Meta, Google Ads, GA4, Shopify or Matomo)
- Open the dashboard and pick a period
- Read the AI assessment and output it as PDF
What you get
- Live metrics per source
- AI interpretation of the numbers
- Five dashboards in one module
- PDF export
Typical use cases
Monday morning: what happened last week?
You choose the period, see metrics per source with a comparison to the previous period and run the detailed AI analysis — anomalies, causes, recommendations. The report goes to the team as PDF or is saved and shared in the workspace.
A question to the numbers
"Which products had the most refunds?", "Where did the traffic come from by country and device?" — you ask Shopify, GA4, Matomo or Google Ads in plain language and get an answer from your data for the chosen period.
The report arrives by itself
You schedule a report daily, weekly or monthly by email; the runs are managed in the Execution Center, the result then sits under "My projects". Ad accounts from your Meta connection you create with one click — the token stays on the server.
Who it's for
Shop owners keeping an eye on revenue and advertising, marketing teams with several data sources, and agencies reporting to clients regularly. The dashboards show and interpret — decisions and changes in the accounts remain with you.
Frequently asked questions
Which sources can I connect?
Meta Ads, Google Ads, Google Analytics 4, Shopify and Matomo — in one module with a tab per source, not as separate tools. You set up connections under Integrations; Google Ads and Meta use the same connection as the Ad Analyzator.
What does the AI do with the numbers?
It puts into context what stands out in the period — a click-through rate below expectation, say — delivers a detailed analysis with action recommendations on click, and answers questions about campaigns, keywords, products, customers or countries.
Can I share and save reports?
Yes. Saved reports are visible to all workspace members; only the person who saved them, or an admin, can delete them. Export as PDF or CSV.
What is a scheduled report?
A report that runs automatically daily, weekly or monthly and arrives by email. Every run is billed in credits and managed in the Execution Center — there you see the runs; the result then sits under "My projects".
What does usage cost?
Loading the metrics is part of the module. Billed in credits are AI analyses, questions to the data and scheduled reports — through a plan or pay-as-you-go; the dashboard shows the requirement before each step.